This is a small update focused on improving performance, adding a few new data points, and upgrading the notes system.
Performance & UI Enhancements
- Faster Offline Graph Loading The graph page will now load significantly faster when you are offline. The app intelligently skips the weather-fetching step if no internet connection is detected, so you no longer have to wait for it to time out.
- New Weather Loading Logic To get you to your data faster, the weather overlay on the graph page now loads in the background. The main altitude chart will appear immediately, without waiting for the weather forecast to download.
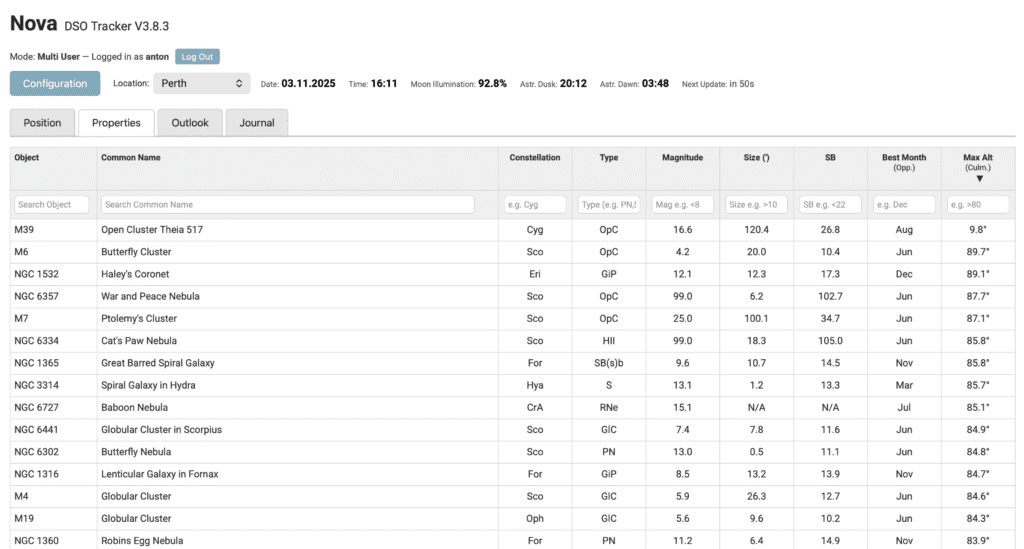
- Index Page Refresh Indicator A new “Next Update in… 60s” countdown has been added to the info bar on the main page. This gives you clear feedback on when the data is scheduled to refresh.
New Features
- New Object Data Columns Added two new columns to the “Properties” tab on the main object list:
- ‘Best Month’: Shows the month (based on RA) when the object is highest in the sky at midnight.
- ‘Max Altitude’: Shows the object’s highest possible altitude (at culmination) from your currently selected location.
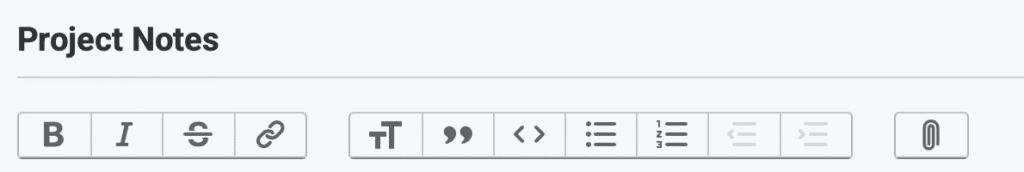
- Rich Text Editors The “Project Notes” (on the graph page) and “Journal Notes” fields have been upgraded from plain text to a full rich text editor. You can now use formatting (like bold, italics, and lists) and even embed images directly into your notes to keep better records.